Business Model Canvas Poster
The TempBox Processes
TempBox processes
To complement the value chain we have broken it down in details into an overview of the processes that is happening from before we attract a customer to the time of delivery.
These processes are based on what we see ourselves doing the first years before integrating more of the activities vertically.
We do not however use the general value chain process. As we are a startup we have decided to do some changes to the structure in the value chain when it comes to processes.
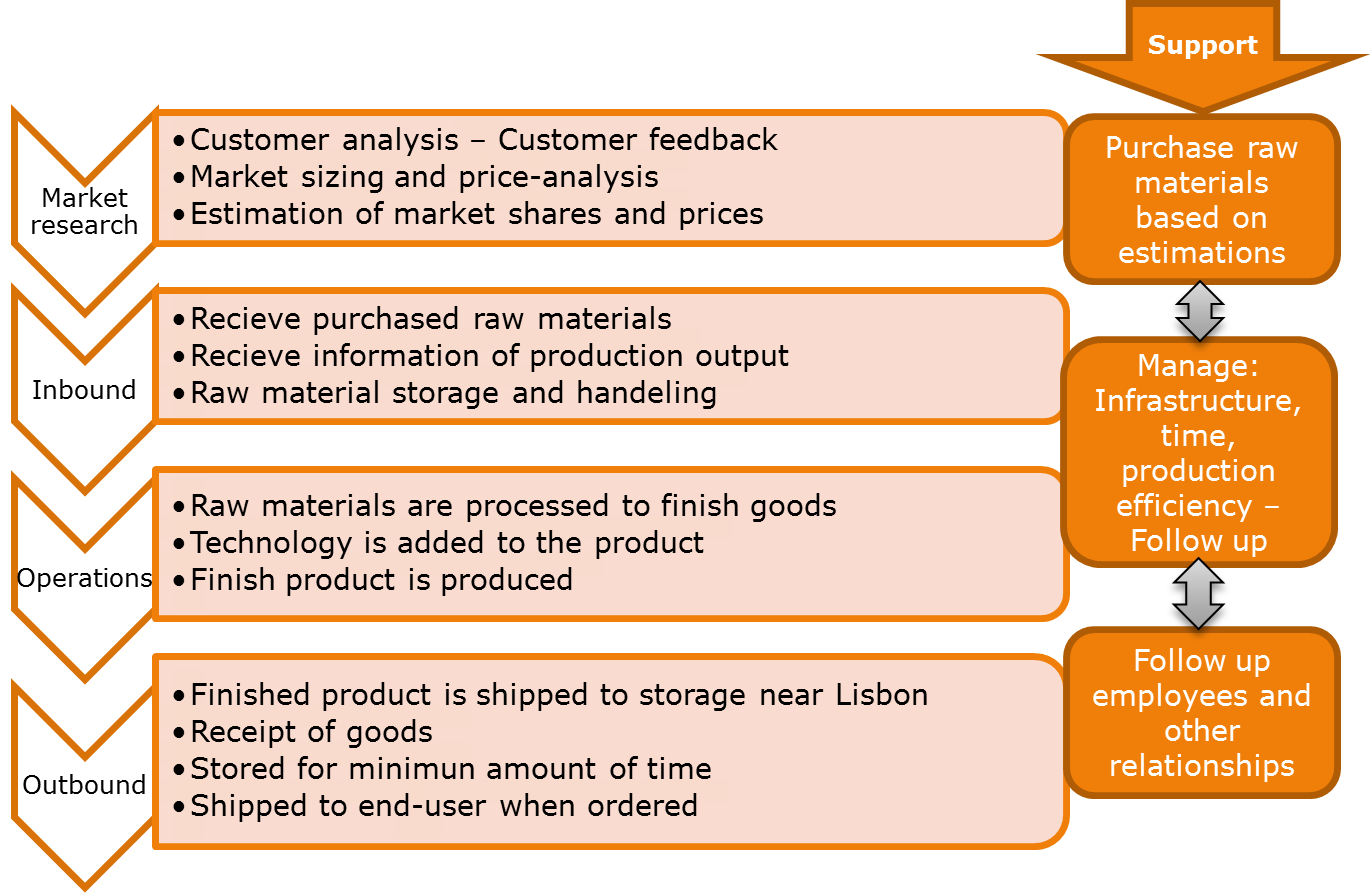
As you can see we have chosen to have market research as the first element in the process, of course this is a continuous process, however we believe this to be at the very start of the production. Firstly, we are already today testing the market, doing research on it, market sizing, price calculations etc. without having started producing. Secondly, the TempBox, as a start-up, the first thing to figure out – Is there a problem that needs to be solved for the customers out there, and can we actually solve it?
The rest of the processes are rather straight forward and do not need much explanations. However on the right side we chose to add some of the most important support activities in the daily operations.
There is the procurement: purchasing materials for production, the infrastructure in the general which is management of the business like measuring performance indicators in outputs, infrastructure (IT and physical), efficiency, material usage, cycle times (time from order to shipped) etc. And also the human relations, if we want to hire people they need training, feedback, rewards, motivation and so on.
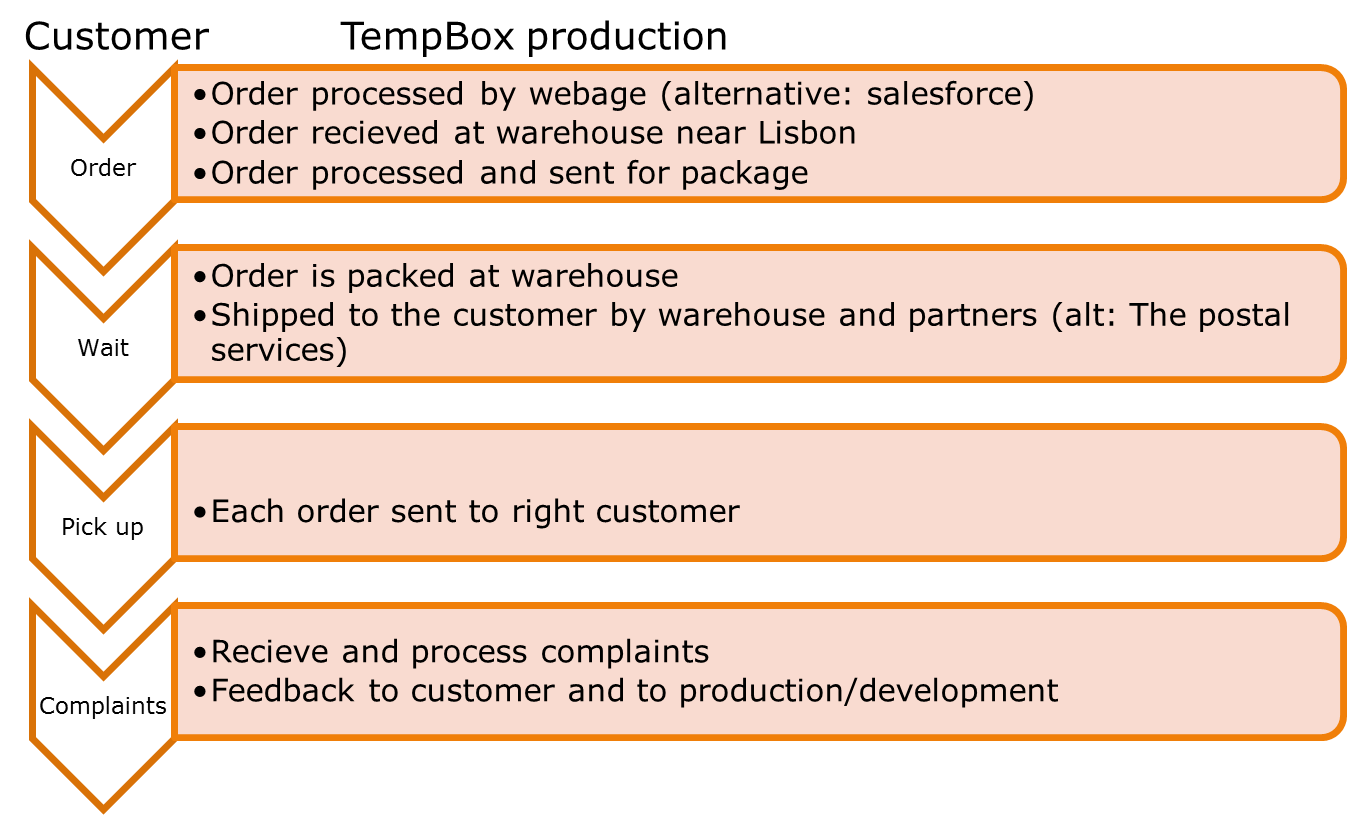
The Customer process
The customer process is broken down into an illustration of the process from ordering to receiving and perceiving the value received.
The value chain of the TempBox
First we want to present our vision and mission (At the time they are not separated as they need to be revised), and our strategic position.
The vision and the mission
«We want to change how people eat on the go – We will give people the freedom of choice, and the ability to save both money and time by providing them a box which keeps the food fresh, and can easily heat it up in several electrical output sockets»
The visions/mission is based (as it should be) on our initial idea of heating food for people on the go. We say we want to change it, not because no-one eats food from a lunch box today, but as we believe people deserve to be able to eat food that is delicious, despite it coming from a lunch box. We will give our customers the freedom of choice to eat whatever, wherever they want, and again of course, heat it up in several sockets!
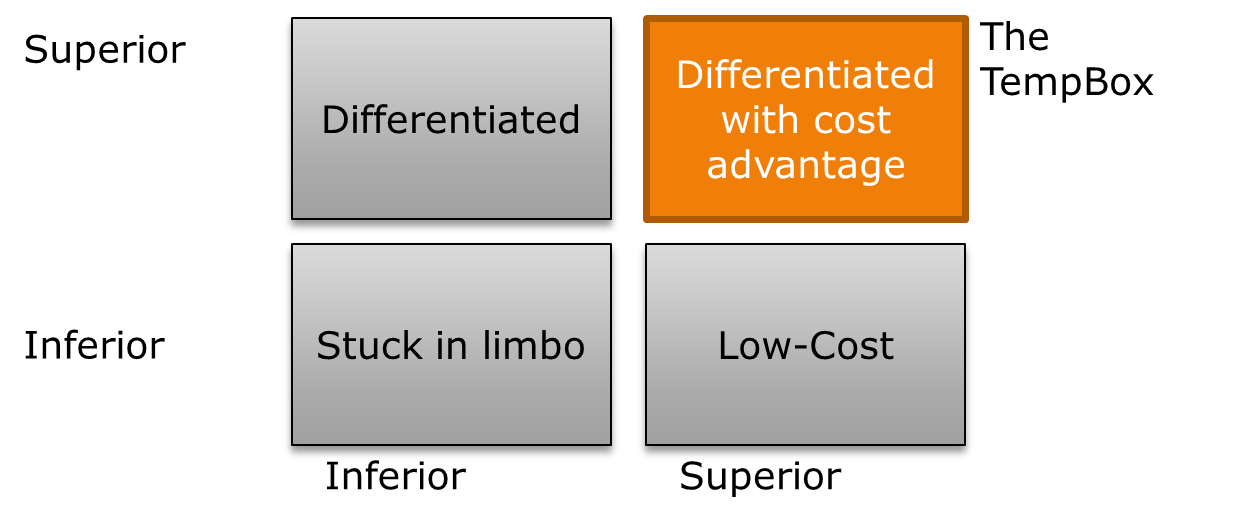
The strategic perspective
Our strategic position has changed from being low-cost to be a differentiated product – with a patent on the design and alternatively the technology, we will have the ability to take a great market share in the heat-able box industry market. At the same time, as we will come back to, we will over time work for obtaining economics of scale and focus on cost-saving at the same time as we deliver a sleek and stylish functional product with the ability to heat and, customer orientation and warrantee benefits. This is our strategic position:
The value chain:
As we have a tangible product it makes more sense to us to have a value chain. To us, a value chain is the strategic management of cost positioning. The linkages and inter-relationships in the value chain is presented as a flow of activities which can, and will be optimized.
With the value chain, we are decomposing the activities of our firm into strategically important units (Stabell and Fjeldstad 1998). With this tool we can more easily see what is important for the TempBox to focus on in house, and what can and should be out contracted at this time.
We are initially the ones with the idea. We will contract most of our key activities – however our value chain is presented with the primary activities in it. We have done this to illustrate how our value chain looks like when you link all the activities that are contracted out together.
We have made the choice to contract out our key activities as this is consistent with our vision and long term strategic objective – We want to be the idea, the brain behind the project. We want to focus on our core competence which is the ideas, market research, customer orientation, partnership management and management and coordination in the company. When we learn more about the industry, production etc. we might consider demolishing some of the contracts and have logistics and production ourselves. We believe that with learning and time we will be able to take most parts of the value chain in house and operationalize and smooth the process so that it will be less costly than managing and paying for the contracted businesses which we do not control and have to depend on.
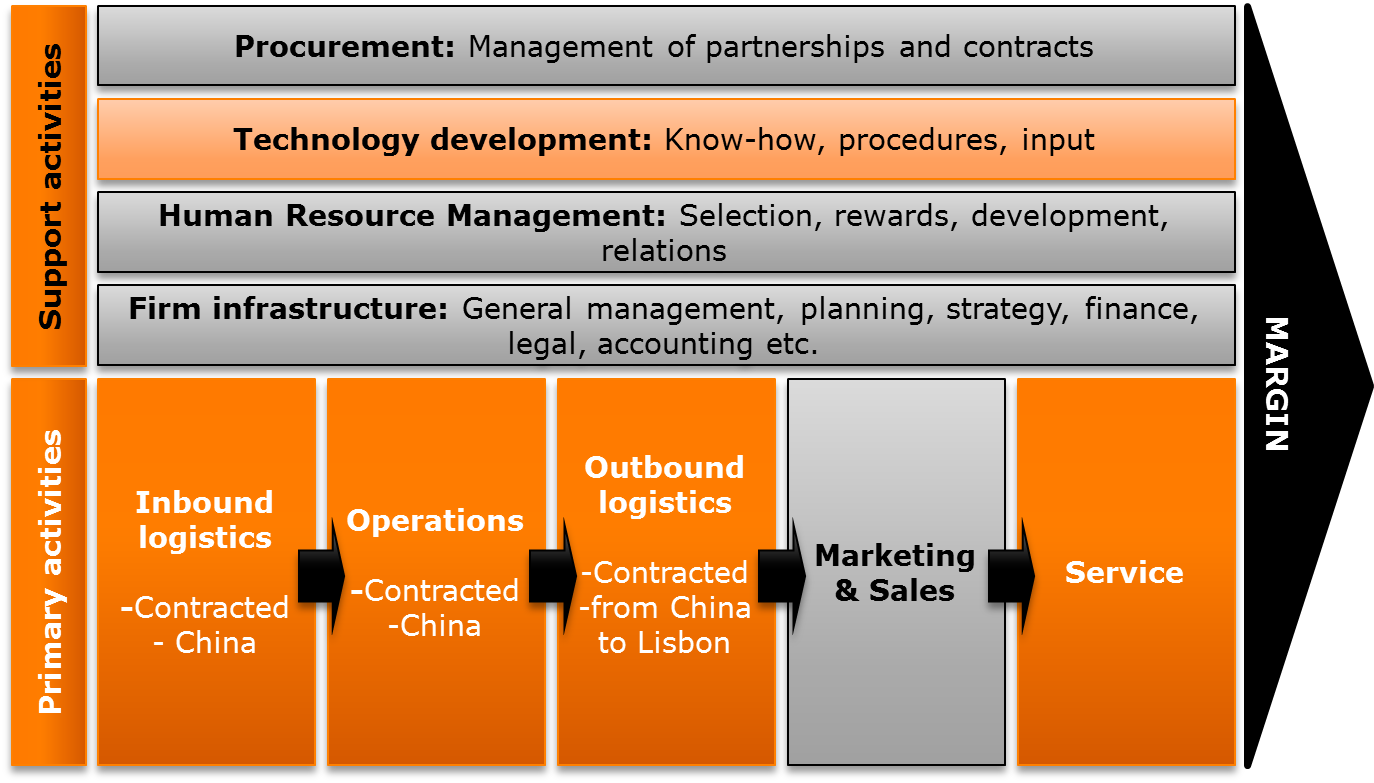
This is our resulting value chain, the grey we will do ourselves, the rest we will contract out, mostly to China.
Inbound logistics: material handling and warehousing – We will not do this: contracted. We have sourced materials and productions in China, therefore all raw materials and handling will be dealt with in China. The product will then be shipped to Lisbon via Garland and dealt with in-house.
Operations: transforming material to the final product – outsourced to production companies in China
Outbound logistics: Order processing and distribution – The final product will be storing in an internal warehouse ready to be shipped to the end consumer. Products will enter the warehouse via an IT system, nothing will enter or leave the warehouse without being registered by the system. Products will be boxed by the warehouse and prepared for distribution. Once the product is prepared the delivery to the end consumer will be outsourced to delivery experts UPS or DHL. Outbound logistics will also include supply and demand planning to ensure that stocks are always at the appropriate levels. This will be done in-house by the warehouse manager who will use the IT system and analyse trends and past data to secure the optimal level of inventory.
Marketing services: We will carry out the marketing services ourselves, however as we grow there is a possibility that this could be partly outsourced (i.e. large scale marketing to India). The marketing services involves market research for estimation of demand which we have already estimated for the first year, however it is a continuous process. Here we will generate demand through the use of marketing tools (this process involves creating awareness through internet-based free tools which has already commenced (numbers will come later)), we will manage our channels through this which is closely aligned with partnerships (we will talk about this later). This box is also about communication with clients, refining the product etc. Hence as this part is our core competence together with the management of all partnerships, we will do this ourselves.
The support activities
We will be carrying out the support activities ourselves. This is where our main business lies. Procurement and management of partnerships will be done by us. It will involving liaising closely with supplier to secure appropriate materials at the best costs, we will come back to this point later in the presentation.
Technology is a lighter shade of orange due to the fact that we are not engineers and we have to partly outsource the technology development. However we will play a role in the development and improvements on the product. Through the feedback of our customers, market research, kinks and problems, we will learn and develop the product further.
Cost and value drivers in the value chain
The cost drivers in the value chain of the TempBox are highly linked to the fact that we are contracting out most our business. We do not have scale advantages, but this will highly influence us in the future as we have one product and a very narrow scope, also we will be larger and better. Highly intertwined with scale are the Linkages and Inter-relationship. At the time we do not believe our value configuration to be optimal due to contracting out most of the primary activities.
Reference:
Stabell, C. B. and Ø. D. Fjeldstad (1998). “Configuring value for competitive advantage: on chains, shops, and networks.” Strategic management journal 19(5): 413-437.
Empathy map, Personas and Interview Debrief
So, as promised in the post about learnings from session 5, we managed to get to know our potential customers better.
We have interviewed 20 people to test and validate the hypothesis. We are happy to say that our value propostiton is mostly confirmed. There are some changes to be made so please stay tuned. They will come later!
Here is our presentation on our customers:
The TAM, SAM and SOM
1. Segmentation and market sizing
We are starting a business that aims at giving people on the move the freedom to choose what and when to eat. Since people on the move have access to restaurants, cafes, bars, with more, our option must address those that are tired of one or more aspects by having to buy their meal. They want to eat meals of their own choice, having free access to preferred meals: either it is because of budget, diet, allergies, and/or other preferences. Or they might be tired of standing in line, using their spare time to wait for food.
è Heat-able lunchbox with multiple opportunities to plug helps solving these problems.
1.1 Total Available Market (TAM):
The total available market, which is also sometimes called the Total Addressable market can be seen as the market you would serve in a world with no constraints and competitors. Meaning that in established markets it would be the total sales in that market if the company was a global reaching monopoly (Technotes 2013)
1.1.1 Top Down method:
To find the TAM there are two different methods which are commonly used. The first is the top down which we will use. Here we start with the population in the world and work ourselves down to our market size.
Our Total Available Market is the population on the planet moving away from their home during the day, especially those in relation to work or school. We envision our TAM as in addition to be everyone with a lunchbox today, also as the entire work/school force of the planet which is searching for a better alternative to buying lunch out.
The total world population is the starting point, however it is not our market. Since the density of people on the move (especially students and workers) is largest in developed urban areas, and further the amount of people standing in lines to buy food, is on a diet, has special preferences etc. is probably higher in developed urban areas (do to a more consumption oriented economy), we use this as the first filter in our top down method:
In 2009, people living in urban areas is 3, 42 billion, which is slightly over half of the earth’s population (United Nations 2013).
Approximately 67% of these are in the workable age from 15 to 64 (Eurostat 2012): 3,42*0.67 = 2.29 billion people in urban areas in the workable age.
In general, looking at numbers from the US and EU, 60% of people in the workable age 15-64 is actually working (Eurostat 2013): 2.29*0.6 = 1.37 billion people.
As our numbers are based on mere estimations and show an unrealistic best case scenario, we will be cautious and reduce it and round it down to approximately 1 billion people:
Around 1 billion people in the world live and go to school in urban areas. Out of these people many will not be interested due to not having a problem with cues or budget, or they might have good and easy access at their work/school-place. That takes us to the SAM, which makes us able to apply the opposite approach.
1.2 SAM and SOM using the bottom up approach
The bottom up approach gives us a more realistic assumption of the market. Here we take constraints, competitors and demand into account. Here we identify customer segments and what we want to achieve.
1.2.1 Serviceable Addressable Market (SAM):
SAM is the part of the market we will target, meaning the part of TAM we are actually planning to focus on. When targeting a market it must be segmented first. In addition, calculations of actual capacity must be taken into account. We have done a rough segmentation when making the Business Model 1.0 where we chose the market: People on the move, for instance workers and students.

Segmentation: As the whole working urban world is a highly visionary market (similar to TAM) due to the assumption that all these people have the problem we are trying to address. Hence, we need to segment the market further:
Capacity: We are only four members of the team. However we are outsourcing the production and distribution of the lunchbox and we are able to distribute to urban areas of Portugal just by ordering more from the selected outsourced production facilities. The most important aspect for us is to calculate the costs and prices we will face to be able to calculate the quantum we are able to sell at what price. Our hypothesis testing will enable us to dig deeper into this matter.
However, our knowledge of the market will be highly based on hypothesis tested by surveys and interviews made in Portugal. In addition, our company will be based in Portugal. Hence, starting with Portugal as the target market seems reasonable.
We have decided to divide the SAM into different stages of success. It goes from 1, which is the starting point, and if successful, we imagine taking the lunch-box out of Portugal also.
Different stages of SAM:
1.stage SAM: All of urban Portugal. In Portugal in 2010 61% of the population lived in urban areas. As Portugal has approximately 11.8 million people, 11.8*0.6 = 7.08 million people live in urban areas,
2. stage SAM: more urban parts in countries in Europe
3. stage SAM: Core segment. Students and workers in urban developed areas, 70% of people in developed urban areas (English Online 2011)
1.2.2 Serviceable Obtainable Market (SOM):
The SOM is the realistic share of the market taken competitors, demand, segmentation, and capacity into account. This means that it is a portion of the SAM as described over.
We have decided to also divide the SOM into stages due to the fact that a start-up SOM will look very different from a launched business SOM.
1. Stage SOM: Students and workers in Lisbon and Porto: We have chosen to focus on one country (Portugal) because of distribution, channels, and knowledge as explained in SAM. Further the capital which also is the biggest city is chosen as a starting point. This is due to the fact that the market is biggest. Due to its economic output, standard of living and market size the Greater Lisbon sub region is one of the major financial and economic centers of the Iberian Peninsula. It is also the political center of the country, the seat of the government and residence of the Head of State (IEPM School 2013). In addition, we live and go to school in Lisbon ourselves and the knowledge about the area will be an advantage when starting up.
There are 150.000 students in Lisbon (Portugal Global 2013).
Population: Lisbon 2.808 million: (Portugal Global 2013).Of these are approximately 67% in the workable age = 1,88 mill, and of these approximately 60% is actually working: = 1.12 million people.
Hence our SOM before taking constraints into account is 1, 27 million people .
When the geographical segment is calculated it is important to keep in mind the other segments based on demographics and psychographics. In addition we have to look at the threats from competition (this is done separately in a SWOT analysis). The three major constraints are:
– Customer need and demand
– Substitutes and competitors
– Resource constraints
2. Stage SOM: Students and workers in Porto in addition to Lisbon.
and 73.000 students in Porto = 223000 students in total
Porto 1.344 million (2009) = 4.152 million people
Total = 1 699 000 + 223 000 = 1 922 000 million people in our geographical segment.
3.Stage SOM: Further into European big cities.
2. In conclusion:
TAM = 1 Billion people
SAM stage 1 = 7, 1 Million people
SOM stage 1 = 1, 27 Million people
3. References (alphabetical)
English Online (2011). “World population.” Retrieved 10.10, 2013, from http://www.english-online.at/geography/world-population/urban-areas.html
Eurostat (2012). “Population Structure and Agening.” Retrieved 9.10, 2013, from http://epp.eurostat.ec.europa.eu/statistics_explained/index.php/Population_structure_and_ageing.
Eurostat (2013). Employment Rates. epp.eurostat.uc.
IEPM School (2013). “Lisbon.” Retrieved 10.10, 2013, from http://iepm.ibs.iscte.pt/?pt=Summer_School_Lisbon.
Portugal Global (2013). “Invest in Portugal.” Retrieved 10.10, 2013, from www.portugalglobal.pt/EN/InvestInPortugal/WhyPortugal
Technotes (2013). “Marketing explaining TAM SAM and SOM.” Retrieved 10.10, 2013, from http://technotes.tostaky.biz/2012/11/marketing-explain-tam-sam-and-som.
United Nations (2013). Population in urban areas. UN. un.org.
SWOT analysis – Revised
The SWOT (Strengths, Weaknesses, Opportunities, and Threats) analysis is a simple, however efficient tool to evaluate own internal strengths and weaknesses in addition to evaluating external opportunities and threats.


Please leave a comment for us if something is unclear or if you have other suggestions. We are Lean Explorers and are highly open to changes!
The old version:

Our hypothesis evaluation
Video Posted on Updated on
Since choosing our ten most important hypothesis last week, we selected ways to test each one and also decided upon how each hypothesis will be confirmed or validated. If you watch the video below, you will see a short presentation of the ten hypothesis forms. Check back in the coming weeks to see how the testing of each one went!
Evaluating the Potential Hypothesis
Earlier in the week we brainstormed potential hypothesis, based on our business model canvas, that we thought were important for the success of our product. We compiled these in the table below and then chose the ten most important statements that really would be crucial to the product success. We did this by scoring each individual hypothesis on importance and likelihood of failure. To get our final score we multiplied the scores for each hypothesis together and then picked the ten with the highest score. As you can see, the chosen ten are all highlighted in bold.
| Value proposition | Scale of importance | Probability of failing | Score | ||||||||||
| 1. Customers would appreciate the ability to bring their own lunch to work/school and heat it | 5 | 2 | 10 | ||||||||||
| 2. Many workers/students are facing a lack of food choice such as healthy, vegetarian, budget etc | |||||||||||||
| 3. Customers consider this a cheaper option/substitute to café/canteen/restaurants etc. | 4 | 2 | 8 | ||||||||||
| 4. Customers will not consider this product inconvenient | 5 | 3 | 15 | ||||||||||
| 5. Workers/Students are looking for an alternative to the traditional way of eating on the go | 4 | 3 | 12 | ||||||||||
| 7. People are willing to pay a price that will cover our costs and margin | 5 | 2 | 10 | ||||||||||
| 8. People think it is ok to cook extra food for dinner to bring the next day | 2 | 3 | 6 | ||||||||||
| 9. People will buy “heat up food” and bring it in their lunch box | 2 | 4 | 8 | ||||||||||
| 10. People will bring left over take away | 1 | 4 | 4 | ||||||||||
| 11. People appreciate the ability to have access to food when they want it | 3 | 2 | 6 | ||||||||||
| 12. The ability to heat the lunch box will influence the purchasing decision | 5 | 2 | 10 | ||||||||||
| 13. The multi-plug ability will influence the purchasing decision | 5 | 2 | 10 | ||||||||||
| 14. A sleek and stylish design adds value for the customer | 4 | 2 | 8 | ||||||||||
| Channels | |||||||||||||
| 1. Customers would buy the product on our webpage | 3 | 2 | 6 | ||||||||||
| 2. Stores would include our product in their assortment | 3 | ||||||||||||
| 3. Most sales will come from Amazon | 4 | 1 | 4 | ||||||||||
| 4. Promotion through different channels i.e. street sales and pop up shops will raise awareness of the product | 4 | 2 | 8 | ||||||||||
| Key resources | |||||||||||||
| 3. With a viable business model we will be able to raise adequate financial resources | 5 | 4 | 20 | ||||||||||
| Key partners | |||||||||||||
| 1. We will be able to outsource the production | 5 | 1 | 5 | ||||||||||
| 2. We will be able to outsource the design of the product | 5 | 1 | 5 | ||||||||||
| 3. We will be able to partner up with organizations/companies to sell higher quantities for a discounted price | 4 | 2 | 8 | ||||||||||
| Revenue Streams | |||||||||||||
| 1. People in different markets have similar problems that can be solved by the same product | 4 | 3 | 12 | ||||||||||

